GenO project has been carried out for the exam Open Access and Digital Ethics of Digital Humanities and Digital Knowledge course at the University of Bologna. The aim of the project is the analysis and the further re-use of open access datasets, in order to find some kind of new knowledge reachable through the mashup of the original data.
You can directly consult our GitHub repository here.
Introduction
This page contains a detailed analysis about GenO, that aims to explore the status of gender equality both in Europe and all over the world.
Scenario
Gender equality is a broad term that involves a lot of factors: in order to better understand the complex situation about this fundamental human right, we collect datasets about different issues such as labour force, health, education and others more. The research about the datasets has been very challenging, due to the detailed aspects we needed to let the analysis be complete and clear. The result aims to give a heterogeneous perspective on the fundamental human right that is gender equality and how it is (or it is not) guaranteed in different countries.
General Analysis
To see the entire explanatory table about the general analysis click here.
Quality analysis of the datasets
These standards come from an accurate study of two different sources - Project Open Data document (provided by the World Bank and owned by Project Open Data) and Open Data Goldbook for Data Managers and Data Holders (provided by European Data Portal). We chose to rely on these sources because of the different nature of our datasets: as a matter of fact, they are provided both from european and worldwide organizations.
The standards for quality we decided to take in consideration are:
- Accuracy and Reliability: how much are datasets error-free so as to be a reliable source?
- Timeliness: how much time will the datasets be accessible and available?
- Accessibility: are datasets accessible and open, in order to be consulted and studied?
- Description: are data fully described in order to be recognized and totally understood in their qualities?
- Reusability: are datasets made available under an open license in order to be reusable?
- Complete: do the datasets have a high level of indicators in order to be as much complete as possible?
World Bank Group
The data are accurate and reliable because they came from recognized international sources and present the most accurate global development data; furthermore, the dataset includes regional, national and global estimates. The datasets are accessible and open, and they can be downloaded and visualized in different formats. There is the description for data provided by every single country; for what concerns the overview of the dataset, the data are fully described and there are enough indicators to choose among. About reusability, the data can be downloaded, but there are some features allowed only for the ones who log in.
ILOSTAT - International Labour Organization
The dataset provides the description of the subject and the variable taken in consideration. It comes from a reliable source: the data, indeed, are taken from administrative sources, official estimates, household surveys, establishment surveys and national accounts. Then, there is also the description of the methods used for collection and compilation of data. Timeliness is not specified, but data are updated constantly. Data are accessible and reusable and there is the possibility to download them. There is a high number of indicators and the possibility to choose among them and mash up them together.
Eurostat - Statistical Office of the European Union
Datasets coming from Eurostat are fully described with an explanatory test; nevertheless, there are not available information about accuracy and punctuality. The completeness of the data depends on the availability of data from the national statistical institutes: when data are not available, estimated or provisional, it is possible to see it on the table thanks to the notes given by the description. The datasets are reusable and they can be downloaded only in some formats. There are enough indicators both for the selection and the format.
OECD: Organisation for Economic Co-operation and Development
This dataset presents a brief description of the main broad topics: details of the dataset are given in the title of the dataset, that is also a variable. The reliability of the dataset and more detailed information on coverage and accuracy are published in World Health Statistics Annuals. For what concerns the causes of mortality, they are reported with ICD code (International Classification of Diseases) in the documentation and as a variable in the database; the number of deaths and the selected causes are extracted from World Health Organisation Mortality Database available at a link that doesn’t work. Layout and indicators are customizable, are as complete as possible because they come from a reliable source; the whole dataset is also made available for reuse.
UNECE - United Nation Economic Commission for Europe
The variable of the dataset we are interested in is briefly described; then, there is the possibility to set all the variables thanks to a path that allows you to create your queries. The source’s data are reliable because they come from official sources (compiled from national and international (UNICEF TransMONEE) official sources); footnotes are provided to understand better when there is a lack of data, availability of places and range of years for every country. There are no information about timeliness. The dataset is accessible and reusable and enough complete: as a matter of fact, missed data depend on the States involved.
Our World in Data
Datasets provided come from reliable sources and there are a lot of ways to visualize data. They are accessible and accurate as much as possible concerning the value used; furthermore, there is a full documentation that gives information about the data. The data are made available under a CC-By license and so they can be reused, downloaded and cited. The level of indicators is enough to let the dataset be complete, even because all the topics are divided into subtopics that have precise and accurate graphs referred to a specific variable.
UNICEF’s Data & Analytics
The dataset provides only the description of the indicator, and then there is the possibility to build your own dataset, customizing the data and the visualization through a series of indicators and visualization models. The dataset is free to reuse and download. The source is high reliable and high importance is given to data itself. Indeed, they state: “When the right data are in the right hands at the right time, decisions can be better informed, more equitable and more likely to protect children’s rights”.
Legal analysis
To see the complete table about the legal checklist click here
The data we collected derive from different sources that use different licences. Therefore, we looked for the licence used by every source. Moreover, there are other aspects to be considered in order to do a proper legal analysis of the dataset: transparency, mention of the specific legal regulation, privacy, liability, point of contact. Leading with these aspect is important to improve the reliability of the publisher to the eyes of any stakeholder.
World Bank Group: The license used is Creative Commons Attribution 4.0 International License (CC BY 4.0). There is a section that includes all the information concerning legal regulation and privacy. There is a mail contact to use as a point of contact.
ILOSTAT - International Labour Organization: There is a lack of information concerning legal aspects, due to the broken links that should refer to. The explicitly mentioned license is related to audio and video published by ILOSTAT; even if for the datasets the license is not explicitly mentioned, it is stated that for non-commercial purposes, any required permission is granted and no further permission must be obtained from the ILO, but acknowledgement to the ILO as the original source must be made.
Eurostat - Statistical Office of the European Union: The license used is Creative Commons Attribution 4.0 International (CC BY 4.0) licence. In the section regarding legal aspects and regulation, there is also mentioned the regulation about personal data protection (Regulation (EU) 2018/1725). The point of contact mentioned is Europa Web Communication unit in DG Communication, that can be contacted with the specific form in the section.
OECD: Organisation for Economic Co-operation and Development:The sections regarding Terms of Use provides information about the reuse of data, availability and APIs. The license is not explicitly mentioned, but it is stated that you can extract from, download, copy, adapt, print, distribute, share and embed Data for any purpose, even for commercial use. Appropriate credits must be given to OECD.
UNECE - United Nation Economic Commission for Europe: There is a page concerning the terms of use of the data, that are available free of charge. There is not explicit information about the license used, even if it is written that users are free to copy, reproduce and redistribute the data for both commercial and non-commercial purposes providing UNECE as the source of data. There isn’t the possibility to go on the Terms of Use and Privacy Policy pages.
Our World in Data: The license used by Our World in Data is CC BY 4.0 and it is made explicit in the footer. In the Privacy Policy page it is fully described the way in which Our World in Data collects and use the personal data, in accordance with the GDPR and related UK data protection legislation.
UNICEF’s Data & Analytics: The license used is not explicitly mentioned, but it is stated that reusing information and data is permitted only after submitting and obtaining a written request. There is a page dedicated to Open Data, but the legal aspects related to UNICEF’S Data&Analytics are linked to the external Unicef site and so there are not specific legal information about UNICEF’s Data & Analytics.
Ethical analysis
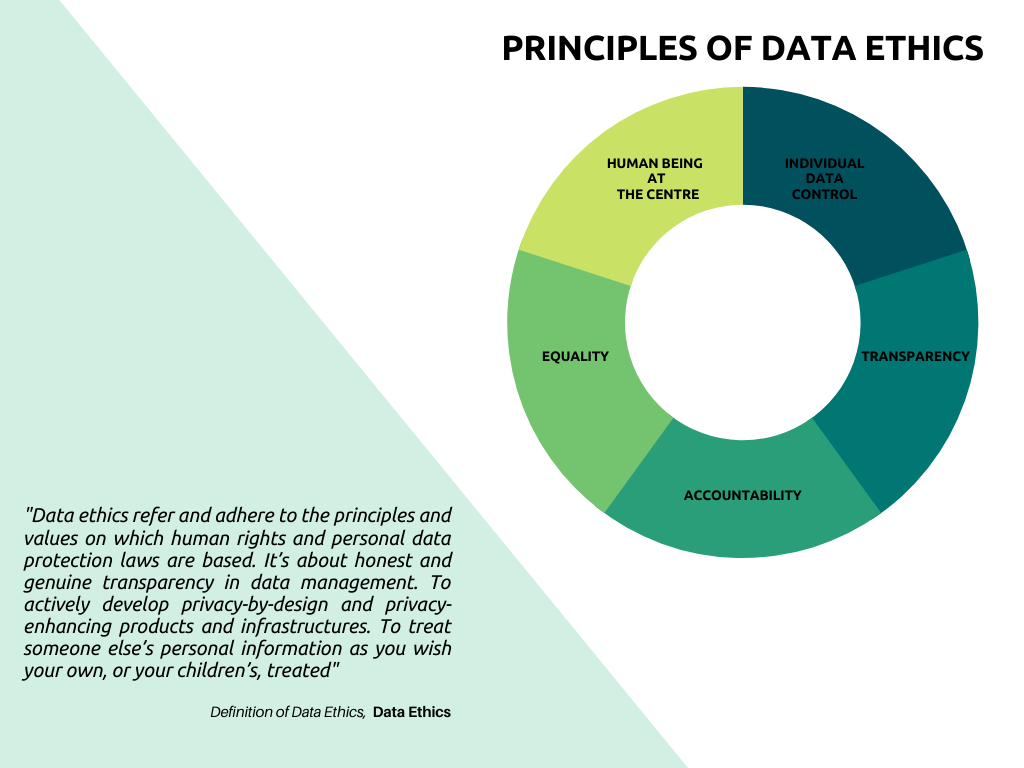
For our ethical analysis, we took in consideration the main aspects and principles of data ethics: the importance of the human being, transparency, accountability, equality. In addition, we analyzed also if our dataset were free from cognitive bias. We relied on two documents: Data Ethics: Principles and Guidelines for Companies, Authorities & Organisations and Data Ethics Framework by UK Government.
World Bank Group: Ethical behaviour and integrity are the core of World Bank Group. This is promoted by The Bank Group's Ethics and Business Conduct Department (EBC), that promotes the development and application of the highest ethical standards by staff members. Data are human-centered, especially because of the topic of the dataset (labour force), transparency and equality are guaranteed. The dataset is bias free.
ILOSTAT - International Labour Organization: ILOSTAT follows the ethical principles for statistics as stated here: Fundamental principles of Official statistics. Data are strictly confidential and used only for statistical purpose. One of the fundamental element for ILOSTAT is the accessibility of data and the impartiality of the production of data. Dataset from ILOSTAT are bias free and transparent.
Eurostat - Statistical Office of the European Union: Eurostat works in order to offer the most proficient statistical analysis to the user. There are no cognitive bias or prejudices in the data managed and there is also a particular attention to the methodological aspects, in order to facilitate the understanding of the data. The transparency of the methodologies is guaranteed through a particular document that provides all the information about the policies of Eurostat.
OECD: Organisation for Economic Co-operation and Development: Integrity, transparency and accountability are the values on which OECD bases its work. The OECD also supports governments in designing and implementing policies by providing policy advice and recommendations on how to integrate these core principles into public sector reforms.
UNECE - United Nation Economic Commission for Europe: UNECE bases its work on the principles of confidentiality, data security, transparency - the access, use and sharing of data is transparent, and is communicated clearly and accessibly to the public. There is a greater transparency around how data is shared, linked, and used. Dataset are bias free.
Our World in Data: Ethical perspective is at the basis of OWID work, especially for the topic the dataset covers. All the information are bias free and transparent. The purpose of the data collection is clear.
UNICEF’s Data & Analytics: UNICEF standards for research and data collection are respect, confidentiality and integrity and this relates especially to the managing of the data from countries all over the world. The dataset is in accordance with the highest standards of integrity, including honesty, truthfulness and fairness.
Technical analysis
World Bank Group
Format: xlsx, csv, tabbed txt.
Metadata: They are divided into two groups, metadata about the series and about the countries. Those on the series contain information about the type of license (CC-BY-SA 4.0) and its URL, the name of the indicator, its code and its long definition, the topic, the period, the aggregation method, the statistical method, and general comments. The country metadata contain information on country codes, their extended names, income group, region, currency, census year, and many other pertinent information about individual countries.
URI: Labor force, female (2000-2020)
Provenance: Labor force, female (2000-2020)
ILOSTAT - International Labour Organization
Format: csv, dta, sav, json, rds, sas7bdat.
Metadata: no metadata available.
URI: Labor force by sex, age and marital status (2012-2019)
Provenance: Labor force by sex, age and marital status (2012-2019)
Eurostat - Statistical Office of the European Union
Format: xlxs, SDMX 2.1, tsv, csv, json.
Metadata: Eurostat provides an immense amount of metadata on its datasets expressed in SDMX format, an ISO standard since 2013 for the exchange of statistical data and metadata in XML format. These metadata contain information on contacts, on the updating of the metadata themselves, on the presentation of data, on the units of measurement, on the reference period, on the institutional mandate, on confidentiality, on the distribution policy, on the frequency of dissemination, on accessibility, on quality, relevance, accuracy, consistency, cost, review and any comments.
URI:
- Life expectancy by age and sex (2018)
- Gender pay gap in unadjusted form (1994 - 2006)
- Individuals with above basic level of digital skills in Information domain, by Gender (2019)
Provenance:
- Life expectancy by age and sex (2018)
- Gender pay gap in unadjusted form (1994 - 2006)
- Individuals with above basic level of digital skills in Information domain, by Gender (2019)
OECD: Organisation for Economic Co-operation and Development
Format: xlxs, SDMX (XML), csv, PC-axis.
Metadata: OECD provides metadata on contacts, date of last update, sources, definitions and used methods.
URI: Causes of mortality, by sex (2000-2018)
Provenance: Causes of mortality, by sex (2000-2018)
UNECE - United Nation Economic Commission for Europe
Format: csv, tsv, json.
Metadata: UNECE provides metadata on the date of the last update, on the contacts, on the unit used and the type of data, on the creation date, on the copyright, on the source, on the definitions and on the countries considered in which period.
URI: Enrolment rate of children in child care (2005-2017)
Provenance: Enrolment rate of children in child care (2005-2017)
Our World in Data
Format: csv.
Metadata: Our World in Data provides metadata on the considered time interval, authors and publication date, source, definitions, methods and other comments.
URI:
Provenance:
UNICEF’s Data & Analytics
Format: csv, xlsx.
Metadata: no metadata available.
URI: Gender gap in upper secondary education (2011-2017)
Provenance: Gender gap in upper secondary education (2011-2017)
Mashup and output datasets
In order to manage the mash-up of different datasets we followed the Guidelines on FAIR Data Management in Horizon 2020. In accordance with these guidelines, we pursued the objective to make our research data findable, accessible, interoperable and re-usable (FAIR).
Findable: the first step in (re)using data is to find them. Metadata and data should be easy to find for both humans and computers. Machine-readable metadata are essential for automatic discovery of datasets and services, so this is an essential component of the FAIRification process.
F1. (Meta)data are assigned a unique identifier: both the data we retrieved in the original datasets, the mashed up data and the metadata we created according to the DCAT-AP are compliant with this point, presenting URI.
F2. Data are described with rich metadata: we associated a rich amount of metadata compliant with the DCAT-AP specification, including not only all the mandatory classes with their respective mandatory properties but also some recommended and optional properties that were useful for our data.
F3. Metadata clearly and explicitly include the identifier of the data they describe: for each dataset that is part of a catalogue and for our own dataset we associated to the metadata a unique identifier of the data described by means of the DCAT-AP optional property for datasets dct:identifier.
Accessible: once the user finds the required data, she/he needs to know how can they be accessed.
A1. (Meta)data are retrievable by their identifier using a standardised communications protocol: all the data we collected and mashed up and the relative metadata are retrievable through the HTTP or its extension HTTPS. Moreover, we provided also an explicit and clear contact protocol in the metadata by means of the names and emails of the data and metadata providers.
Interoperable: the data usually need to be integrated with other data. In addition, the data need to interoperate with applications or workflows for analysis, storage, and processing.
I1. (Meta)data use a formal, accessible, shared, and broadly applicable language for knowledge representation: we used JSON, CSV and XML for the representation of the mashed up data and RDF with the Turtle syntax to describe and structure the metadata. As for the XML format, both well-formed and valid documents have been produced, using SDMX 2.1 as schema, which stands for Statistical Data and Metadata eXchange. It is an international initiative that aims at standardizing and modernizing (“industrialising”) the mechanisms and processes for the exchange of statistical data and metadata among international organizations and their member countries. It was released in May 2011 and was approved by ISO as International Standard (ISO 17369: 2013) in 2013. SDMX is sponsored by seven international organizations including the Bank for International Settlements (BIS), the European Central Bank (ECB), Eurostat (Statistical Office of the European Union), the International Monetary Fund (IMF), the Organization for Economic Cooperation and Development (OECD), the United Nations Statistical Division (UNSD), and the World Bank.
I2. (Meta)data use vocabularies that follow FAIR principles. We used the ISO 3166-1 alpha-3 standard vocabulary to represent nations, the International Classification of Diseases for the health domain and the Linked Open Data vocabulary specification called DCAT-AP. These vocabularies are documented and resolvable using globally unique and persistent identifiers.
Reusable: the goal of FAIR is to optimise the reuse of data. To achieve this, metadata and data should be well-described so that they can be replicated and/or combined in different settings.
R1. Meta(data) is richly described with a plurality of accurate and relevant attributes: our data and metadata are described through a rich and vary series of labels including the date of collection and modification of the data, the licence, the publisher, the creator, their content.
R1.1. (Meta)data are released with a clear and accessible data usage license (Creative Common License CC BY-SA 4.0).
R1.2. (Meta)data are associated with detailed provenance: our project includes information about the provenance of data in a machine-readable format in the metadata codification.
R1.3. (Meta)data meet domain-relevant community standards: we used the ISO 3166-1 alpha-3 standard for geographic information and the International Classification of Diseases for the health domain.
The principles mentioned above include three types of entities: data, metadata and infrastructure. Given the analysis, we can state that our research data are 100% compliant with the FAIR principles.
A summary table of the produced mashup datasets is shown below.
| Domain | XML/SDMX-ML | JSON | CSV |
|---|---|---|---|
| Labour force | labour.xml | labour.json | labour.csv |
| Life expectancy | health_life_expectancy.xml | health_life_expectancy.json | health_life_expectancy.csv |
| Causes of mortality | health_death_causes.xml | health_death_causes.json | health_death_causes.csv |
| Gender paygap | paygap.xml | paygap.json | paygap.csv |
| Childcare | childcare.xml | childcare.json | childcare.csv |
| Digital economy | digital.xml | digital.json | digital.csv |
| Education | education.xml | education.json | education.csv |
Sostenibility of the update the datasets over the time
The GenO dataset contains datasets that derive from different sources, concerning all the factors involved in the grant of gender equality: labour force, health, education, gender pay gap. The dataset has been created as a project within the Open Access and Digital Ethics course of the Master Degree in Digital Humanities and Digital Knowledge at the University of Bologna: the dataset is not actively maintained, while the datasets used for this project are currently maintained by the relative institutions or organisations. GEO/GenOp is distributed under Creative Commons Attribution 4.0 International License (CC BY-SA 4.0)
Visualization
To improve the data's understanding and make it more accessible to the public, we have produced seven interactive visualizations, distributed as follows:
- A choropleth map for labour, that is an interactive thematic map, which shows the percentage of the female workforce through a color scale and allows you to compare it with the marital status of the same female population. Through a slider, it is possible to view the data from 1990 to 2020.
- A bubble map to visualize the number of deaths for 53 different causes divided by gender from 2000 to 2017.
- A horizontal histogram for life expectancy by gender recorded in 2018. It is possible to reorder the graph alphabetically and by female or male gender, descending or ascending.
- To view the gender paygap, a multi-line chart was used, which allows you to select the countries to be shown and the time span of interest, from 1994 to 2006.
- As for the enrollment rate of children in childcare, a choropleth map centered on Europe was used, showing the data through a slider from 2005 to 2017.
- Individuals with above basic level of digital skills were shown through a vertical histogram. It is possible to reorder the graph alphabetically and by female or male gender, descending or ascending.
- Finally, as far as education is concerned, it is possible to compare the data relating to primary school, secondary school, and the ratio of school years between men and women through a multi-line chart, with a time span ranging from 1970 to 2016. Also, in this case, a modal window allows you to select which countries to consider in the graph, to avoid information overload.
All graphics were created in Javascript using the open source d3.js library. In addition, the open source Leaflet.js library was used for the maps.
RDF assertion of the metadata
In order to offer better reusable and interoperable data, we provided them with their metadata, following the DCAT_AP version 2.0.0 documentation. We have decided to provided metadata for the whole catalogue, but also for each dataset individually. The RDF assertion for the metadata, that follows the Turtle serialization, has been released and can be found in each metadata table (both for the catalogue and the datasets); but can also be consulted here.
Conclusions
GenO is the final outcome of a deep analysis: we started from thinking about a social issue that needed to be examined in depth and, step by step, we followed a process of analysis and study of all the different areas involved. The datasets we analyzed helped us to understand the phenomena both in European Union and worldwide. After this analysis, we can state that gender equality has increased in the last decades, but not all over the world. Furthermore, we observed that, for what concerns gender pay gap, there aren’t as many information as for the other instances and sectors. Some data proved our hypothesis and some other were slightly different when not unexpected, but all there reflections led to a crucial point: women have still less opportunities than men. Data can be the most proficient instrument to understand what are the next steps to take to reach equality and social justice.